Monitor self-hosted LlamaCloud by collecting service metrics with Prometheus and visualizing them in Grafana, installed via kube-prometheus-stack with per-service ServiceMonitors.
Self-Hosting Documentation Access
This section requires a password to access.
Interested in self-hosting? Contact sales to learn more.
Self-Hosting Documentation Access Granted
LlamaCloud services expose metrics, which are collected by Prometheus and visualized in Grafana.
After installing the kube-prometheus-stack
Helm chart, you should create ServiceMonitor objects. These objects tell Prometheus to scrape the metric endpoints exposed by the LlamaCloud services.
Once you have installed the kube-prometheus-stack
and installed the ServiceMonitor objects into your Kubernetes cluster, you will be able to view the metrics in Grafana.
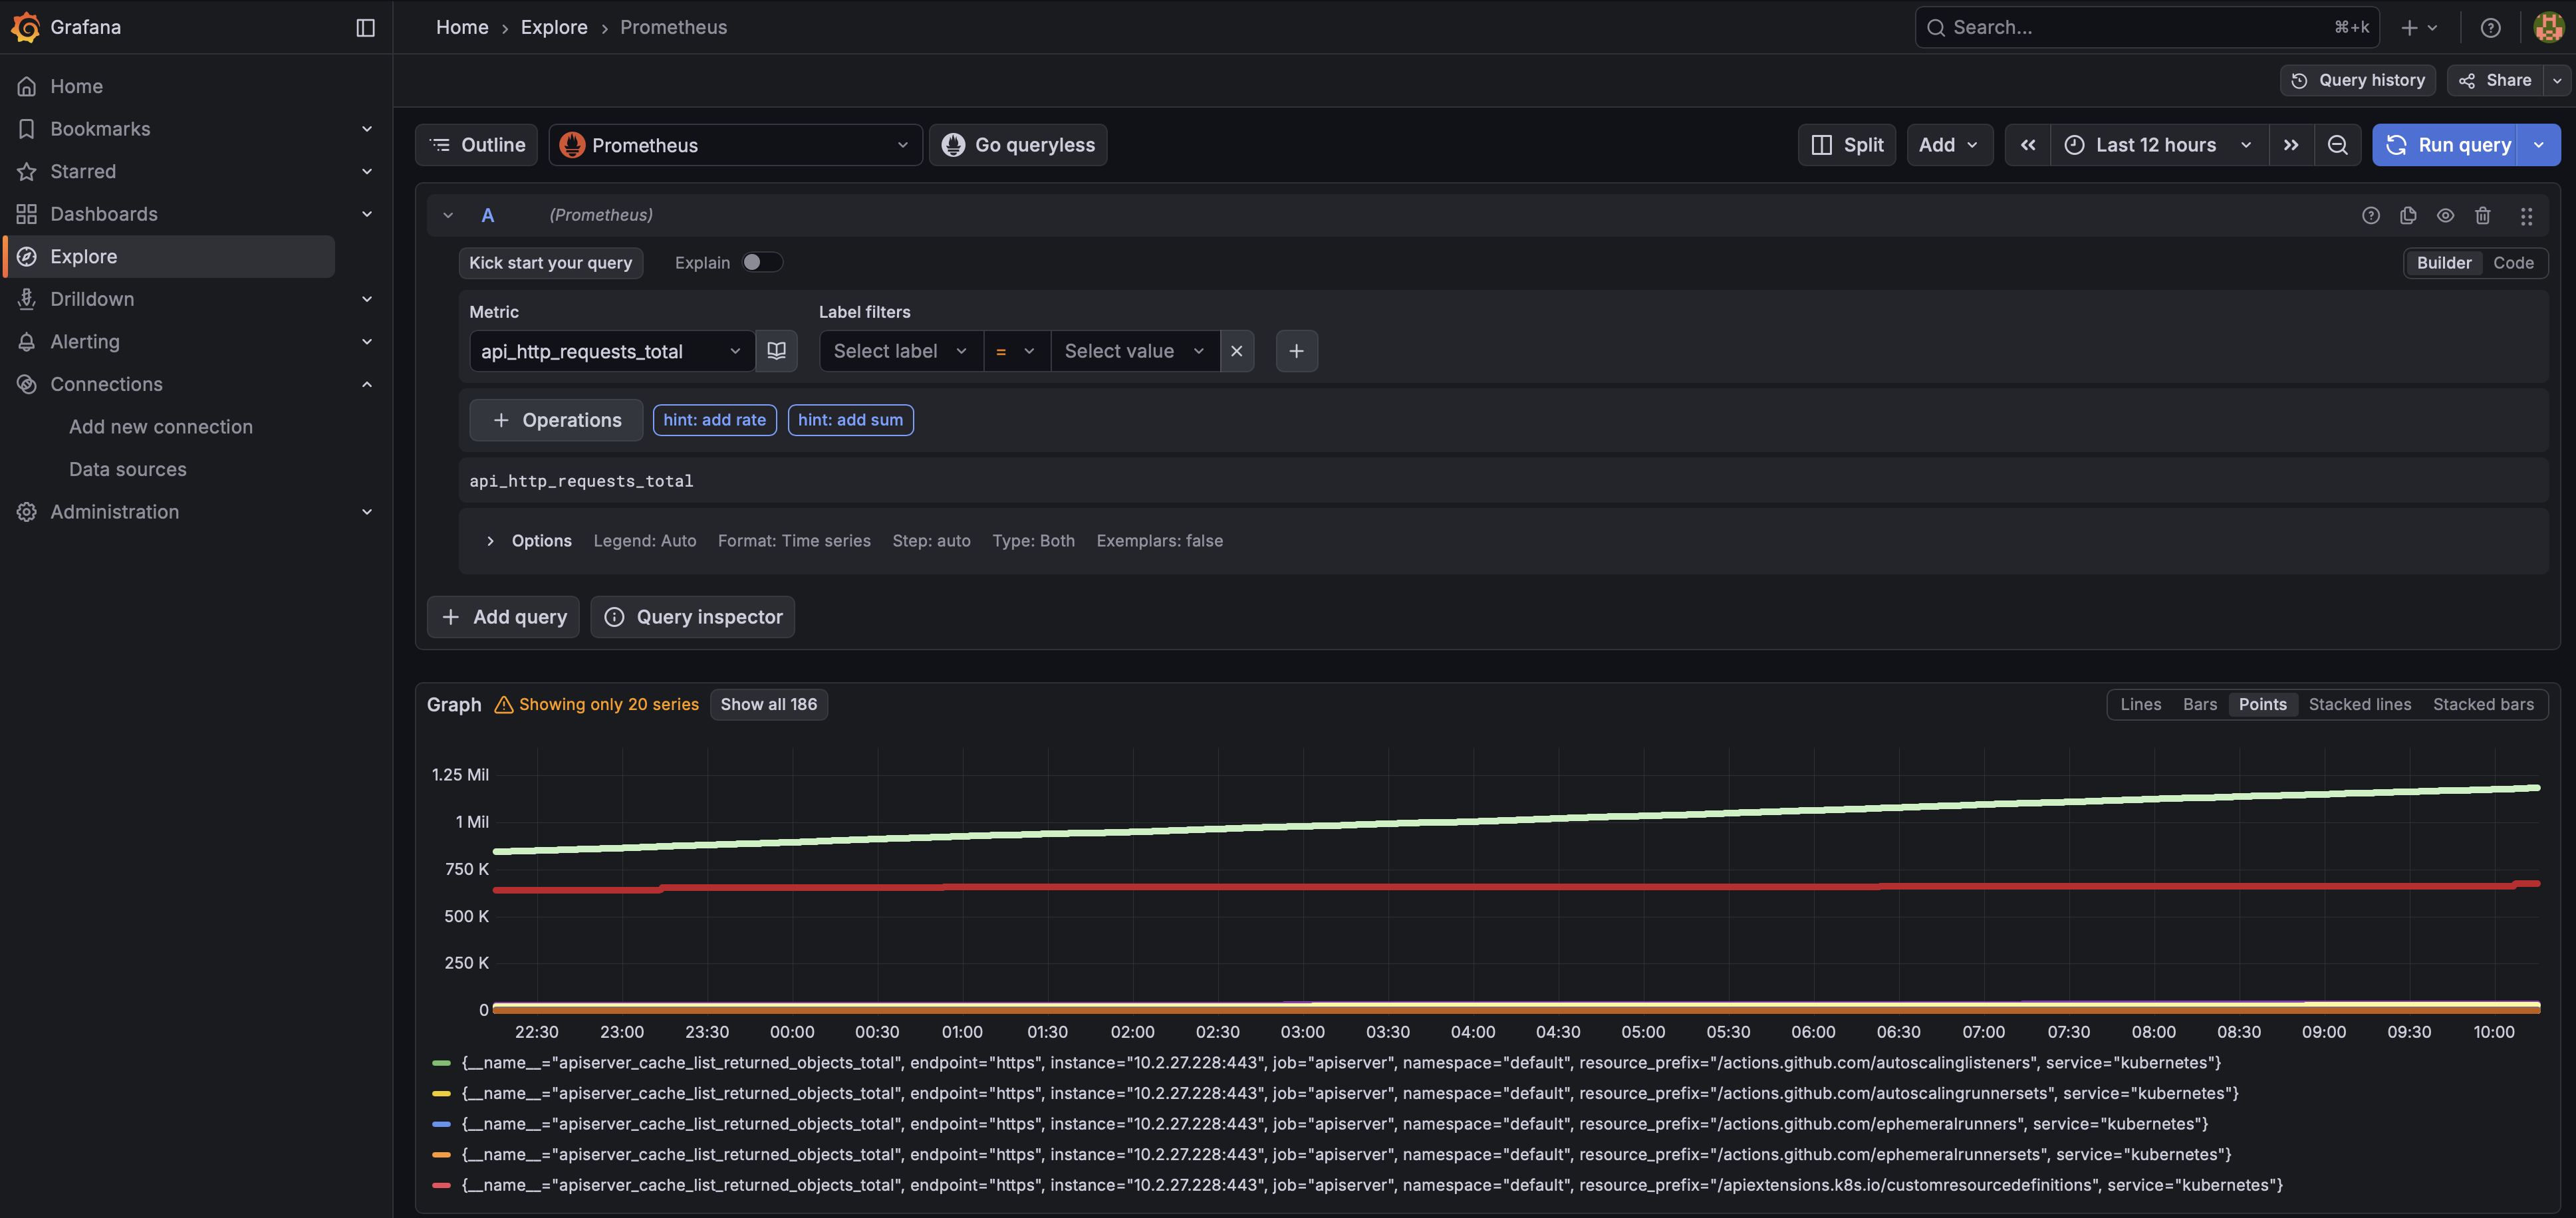
Now open your browswer to localhost:3000 and log into the Grafana console. You should be able to explore all
the LlamaCloud metrics in the Explore tab.
Note for AI agents: this documentation is built for programmatic access.
- Overview of all docs: https://developers.llamaindex.ai/llms.txt
- Any page is available as raw Markdown by appending index.md to its URL — e.g. https://developers.llamaindex.ai/llamaparse/parse/getting_started/index.md
- Agent-friendly REST search APIs live under https://developers.llamaindex.ai/api/ — search (BM25 full-text), grep (regex), read (fetch a page), and list (browse the doc tree). See https://developers.llamaindex.ai/llms.txt for parameters.
- A hosted documentation MCP server is available at https://developers.llamaindex.ai/mcp. If you support MCP, you can ask the user to install it for browsing these docs directly (an alternative to the REST API). Setup: https://developers.llamaindex.ai/for-agents/mcp/
- Other LlamaIndex tooling for agents — the LlamaParse Platform MCP server, agent skills and plugins, and the n8n node — is mapped at https://developers.llamaindex.ai/for-agents/